As traffic flows into your Kubernetes environment, destined for an application running inside the cluster, you might want to examine each request more closely to visualize its journey from the ingress point to the application. This process, known as distributed tracing, can provide insights into how long the request takes to travel from one point to another, which applications the request passes through, and help pinpoint where any errors may have occurred in the traffic flow.
Let’s start by understanding the mechanism behind generating and collecting traces, before jumping into an example of how to do it.
Understanding OpenTelemetry: A Unified Approach to Telemetry Data
OpenTelemetry is an open-source project and framework that provides a unified way to instrument, generate, collect, and export telemetry data for cloud-native applications. This telemetry data can include metrics, logs, and traces. The APIs and SDKs defined by OpenTelemetry support a multitude of programming languages and are designed to be vendor-neutral so that they can be integrated easily into any application.
Traces can be generated by the application using an OpenTelemetry library and then exported to a collector for visualization. The OpenTelemetry Collector is a vendor-agnostic implementation that can receive telemetry data that is sent using the OpenTelemetry Protocol (OTLP) and then process and export the data to a supported backend. In this model, the OpenTelemetry Collector acts as a middleman, processing and forwarding the telemetry data on to the final destination, which could be a collector like Jaeger or Prometheus. One of the benefits of this model is that your applications only need to know about the OpenTelemetry Collector. This means that if you want to export data to multiple collectors, or swap out collectors, only the OpenTelemetry Collector needs to know about this.
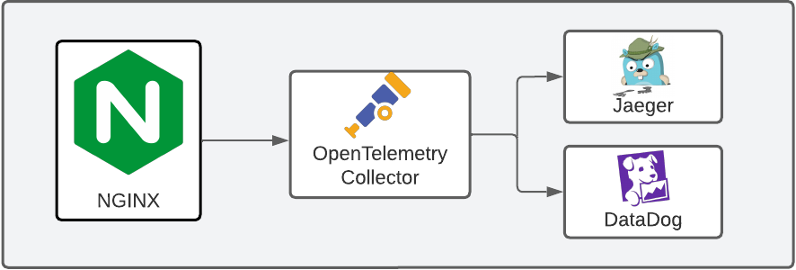
The diagram below shows how the tracing data is exported in this model. The NGINX proxy receives a request and samples a trace for it, exporting the trace to the OpenTelemetry Collector, which processes it and sends it on to Jaeger and/or DataDog.
Many collectors (e.g., Jaeger) understand the OTLP protocol, and therefore allow your applications to export data directly to them. For simple cases, this direct export might be enough. However, using the OpenTelemetry Collector offers the additional flexibility mentioned earlier.
By enabling OpenTelemetry tracing in NGINX Gateway Fabric, we can visualize requests from the ingress point of our Kubernetes cluster to the applications within it.
What Is NGINX Gateway Fabric?
NGINX Gateway Fabric is an open-source project that provides an implementation of the Gateway API using NGINX as the data plane. The Gateway API is an official Kubernetes project focused on Layer 4 and Layer 7 routing in Kubernetes. In other words, using NGINX Gateway Fabric and the Gateway API together allows you to easily define configuration to route your ingress traffic to your applications in Kubernetes.
Now, let’s focus on how to enable tracing in NGINX Gateway Fabric so we can trace that ingress traffic to our applications.
Tracing with the NGINX OpenTelemetry Module
NGINX Gateway Fabric uses the official NGINX OpenTelemetry Module to instrument NGINX to export tracing data. As traffic flows through NGINX and is routed to your applications, the module processes and sends tracing data for that request to the configured collector.
NGINX Gateway Fabric monitors a set of CustomResourceDefinitions (CRDs) that users can create and then attach to the appropriate Gateway API resources to enable and configure tracing.
Enabling Tracing with NGINX Gateway Fabric
To set up NGINX Gateway Fabric with tracing for ingress traffic, you can follow this step-by-step tracing guide on NGINX Docs.
After following the guide, you will be able to see traces for your requests as they are routed from the ingress point to your backend applications in Kubernetes.
Analyzing Traces
With tracing enabled for this traffic, we can observe the response time and other metadata about the requests. Using the following HTTPRoute, NGINX Gateway Fabric will route requests to my own applications.
The following ObservabilityPolicy enables tracing for this route, sampling 100% of the requests:
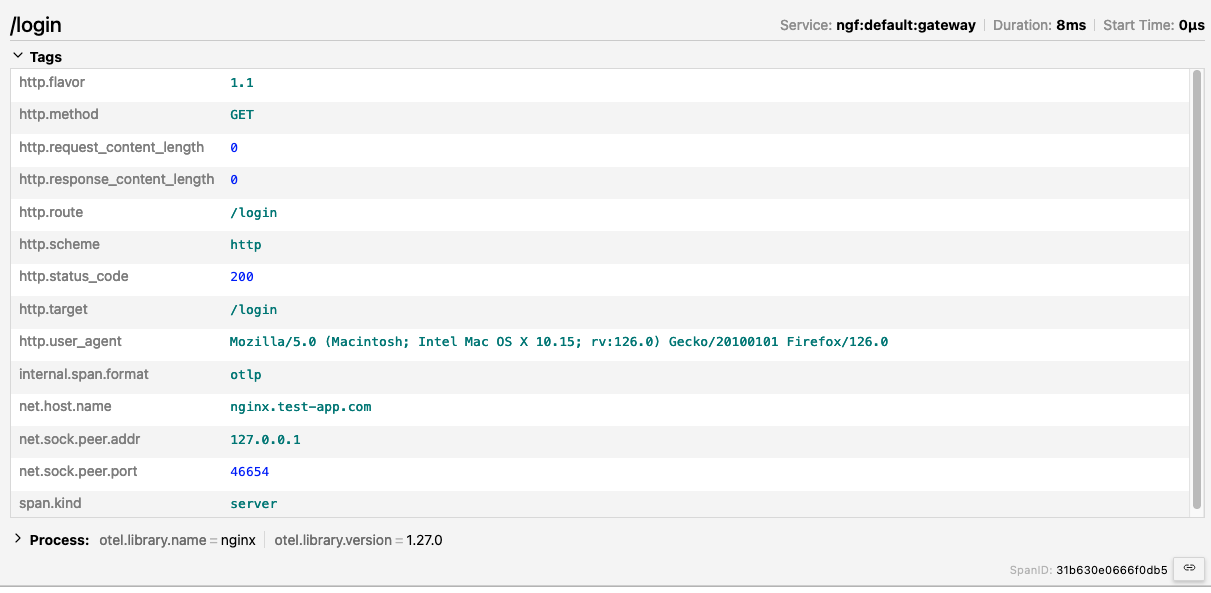
By visiting the /login endpoint in my browser, I can see the expected page. In my Jaeger deployment, a trace is created that looks like the following:
I can also visit the /settings endpoint, but I might receive a vague error message from the application (“Oh no, something went wrong!”) when looking at the trace:
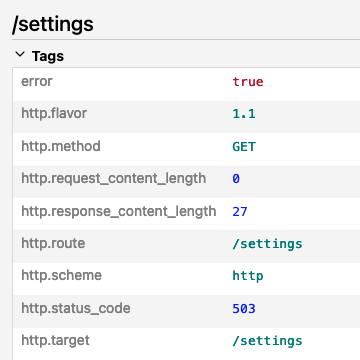
In the image above, we have the error code 503, which means Service Unavailable. The settings application defined in the HTTPRoute must be overloaded or undergoing maintenance. It looks like I need to add some redundancy to this application to prevent this issue in the future. Scaling the application to have more replicas would be a good first step, since I’m currently running just a single instance of it. I should also improve the error message that the application returns when in this specific state, so that I can better understand the problem if it happens again.
Finally, I’ll check the /profile endpoint. This gives a successful response. The trace looks like this:

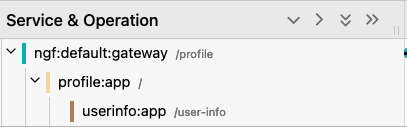
As you can see in the trace, the profile app receives the request from NGINX Gateway Fabric at its root location, and then forwards it on to the /user-info path which lives in another application. The reason that we can see multiple spans in this trace is because I’ve instrumented the profile and user-info applications to export traces using the NGINX OpenTelemetry Module, since both apps are NGINX servers.
Their NGINX configurations contain these directives:
These same directives are what NGINX Gateway Fabric uses to start the initial trace at the ingress point, based on the configuration in your ObservabilityPolicy.
By following a trace through multiple applications, you can better understand the time that each request takes per application, as well as where any errors may originate.
Conclusion
By enabling tracing, we can successfully diagnose and fix a problem with traffic flow to an application in our Kubernetes cluster. While this particular case was straightforward and just involved an HTTP status code, the true power of tracing lies in its ability to provide a comprehensive view of response time and metadata. Additionally, tracing allows us to follow a request from the ingress point through multiple applications. This holistic approach is where tracing truly shines – it offers invaluable insights and is a useful tool for maintaining and optimizing your infrastructure.
If you are interested in NGINX’s implementation of the Gateway API, check out the NGINX Gateway Fabric project on GitHub. You can get involved by:
- Joining the project as a contributor
- Trying the implementation in your lab
- Testing and providing feedback

